Visualize HDF5 in a knowledge graph#
Using kglab (https://derwen.ai/docs/kgl/)
# !pip install kglab
import kglab
import rdflib
---------------------------------------------------------------------------
ModuleNotFoundError                       Traceback (most recent call last)
Cell In[2], line 1
----> 1 import kglab
      2 import rdflib

ModuleNotFoundError: No module named 'kglab'
import h5rdmtoolbox as h5tbx
with h5tbx.File() as h5:
    h5.create_dataset(name='test', data=4.3)
    grp = h5.create_group(name='contact')
    grp.attrs['fname', rdflib.FOAF.firstName] = 'Matthias'
    grp.attrs['lname', rdflib.FOAF.lastName] = 'Probst'
    grp.attrs['hint'] = 'This group could be representing a person.'
    grp.rdf['hint'].definition = 'A hint gives helpful information on something.'
    grp.rdf.type = rdflib.PROV.Person  # --> rdf.type = Person
    grp.rdf.subject = 'https://orcid.org/0000-0001-8729-0482'  # -> @id='https://orcid.org/0000-0001-8729-0482'

    print(h5.dump_jsonld(indent=2, structural=True, resolve_keys=True))

g, ctx = h5tbx.jsonld.get_rdflib_graph(h5.hdf_filename)
{
  "@context": {
    "foaf": "http://xmlns.com/foaf/0.1/",
    "hdf5": "http://purl.allotrope.org/ontologies/hdf5/1.8#",
    "prov": "http://www.w3.org/ns/prov#",
    "skos": "http://www.w3.org/2004/02/skos/core#"
  },
  "@graph": [
    {
      "@id": "_:N1",
      "@type": "hdf5:File",
      "hdf5:rootGroup": {
        "@id": "_:N0",
        "@type": "hdf5:Group",
        "hdf5:member": [
          {
            "@id": "https://orcid.org/0000-0001-8729-0482",
            "@type": [
              "hdf5:Group",
              "prov:Person"
            ],
            "foaf:firstName": "Matthias",
            "foaf:lastName": "Probst",
            "hdf5:attribute": [
              {
                "@id": "_:N2",
                "@type": "hdf5:Attribute",
                "hdf5:name": "fname",
                "hdf5:value": "Matthias"
              },
              {
                "@id": "_:N3",
                "@type": "hdf5:Attribute",
                "hdf5:name": "hint",
                "hdf5:value": "This group could be representing a person.",
                "skos:definition": "A hint gives helpful information on something."
              },
              {
                "@id": "_:N4",
                "@type": "hdf5:Attribute",
                "hdf5:name": "lname",
                "hdf5:value": "Probst"
              }
            ],
            "hdf5:name": "/contact"
          },
          {
            "@id": "_:N5",
            "@type": "hdf5:Dataset",
            "hdf5:datatype": "H5T_FLOAT",
            "hdf5:dimension": 0,
            "hdf5:name": "/test",
            "hdf5:size": 1
          }
        ],
        "hdf5:name": "/"
      }
    }
  ]
}
ctx
{'hdf5': 'http://purl.allotrope.org/ontologies/hdf5/1.8#',
 'prov': 'http://www.w3.org/ns/prov#',
 'foaf': 'http://xmlns.com/foaf/0.1/',
 'skos': 'http://www.w3.org/2004/02/skos/core#'}
# g = rdflib.Graph()
# bn = rdflib.BNode()
# g.add((bn, rdflib.URIRef('https://schema.org/name'), rdflib.Literal('Matthias')))
kg = kglab.KnowledgeGraph(
    import_graph=g,
    namespaces=ctx)
subgraph = kglab.SubgraphTensor(kg)
VIS_STYLE= {"hdf5": {"color": "red", "size": 30},
            "_": {"color": "black", "size": 20}}
pyvis_graph= subgraph.build_pyvis_graph(notebook=True, style=VIS_STYLE)
#pyvis_graph.show('graph.html', notebook=True)
# the above call fails in the readthedocs build process... we show an image of the result here:
Warning: When cdn_resources is 'local' jupyter notebook has issues displaying graphics on chrome/safari. Use cdn_resources='in_line' or cdn_resources='remote' if you have issues viewing graphics in a notebook.
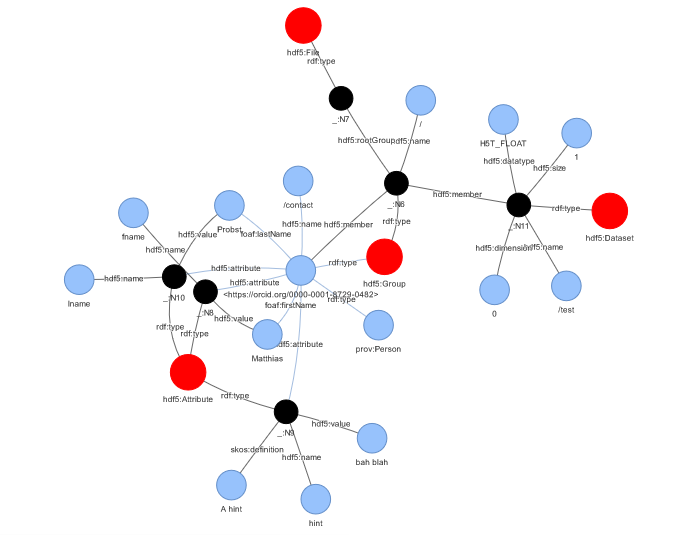
with h5tbx.File() as h5:
h5.create_dataset(name='test', data=4.3)
grp = h5.create_group(name='contact')
grp.attrs['fname', rdflib.FOAF.firstName] = 'Matthias'
grp.attrs['lname', rdflib.FOAF.lastName] = 'Probst'
grp.attrs['hint'] = 'bah blah'
grp.rdf['hint'].definition = 'A hint'
grp.rdf.subject = rdflib.PROV.Person
grp.attrs['@id'] = 'https://orcid.org/0000-0001-8729-0482'
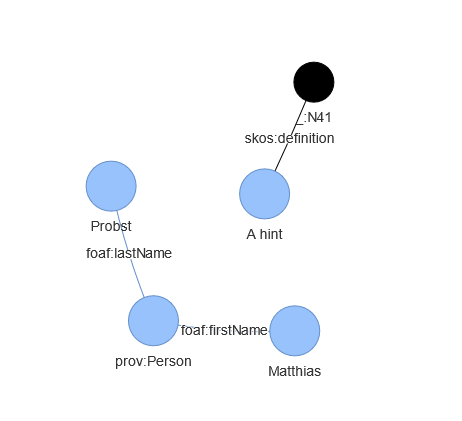
print(h5.dump_jsonld(indent=2, structural=False))
g, ctx = h5tbx.jsonld.get_rdflib_graph(h5.hdf_filename)
{
  "@context": {
    "fname": "http://xmlns.com/foaf/0.1/firstName",
    "lname": "http://xmlns.com/foaf/0.1/lastName"
  },
  "@graph": [
    {
      "@id": "http://www.w3.org/ns/prov#Person",
      "fname": "Matthias",
      "lname": "Probst"
    },
    {
      "@id": "_:N14",
      "http://www.w3.org/2004/02/skos/core#definition": "A hint"
    }
  ]
}
jsonld = h5tbx.dump_jsonld(h5.hdf_filename, indent=2, semantic=True, structural=False)
with open('test.jsonld', 'w') as f:
    f.write(jsonld)
VIS_STYLE= {"hdf5": {"color": "red", "size": 30},
            "_": {"color": "black", "size": 20},
            "prof": {"color": "green", "size": 10},
            "foaf": {"color": "green", "size": 10}}
kg_from_jsonld = kglab.KnowledgeGraph().load_jsonld('test.jsonld')

subgraph = kglab.SubgraphTensor(kg_from_jsonld)
pyvis_graph = subgraph.build_pyvis_graph(notebook=True, style=VIS_STYLE)

pyvis_graph.force_atlas_2based(overlap=0)
# pyvis_graph.show("tmp.grpah.html", local=True, notebook=True)
# the above call fails in the readthedocs build process... we show an image of the result here:
Warning: When cdn_resources is 'local' jupyter notebook has issues displaying graphics on chrome/safari. Use cdn_resources='in_line' or cdn_resources='remote' if you have issues viewing graphics in a notebook.