Visualize HDF5 in a knowledge graph#
Using kglab (https://derwen.ai/docs/kgl/)
# !pip install kglab
import kglab
import rdflib
import h5rdmtoolbox as h5tbx
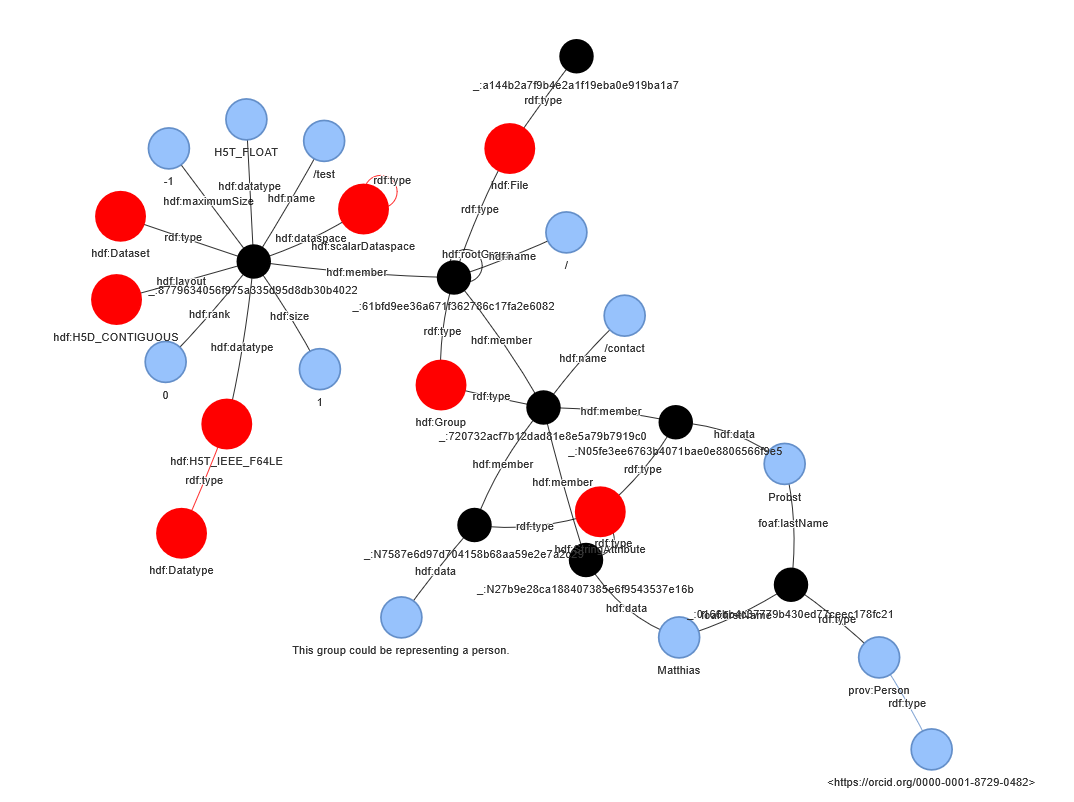
with h5tbx.File() as h5:
    h5.create_dataset(name='test', data=4.3)
    grp = h5.create_group(name='contact')
    grp.attrs['fname', rdflib.FOAF.firstName] = 'Matthias'
    grp.attrs['lname', rdflib.FOAF.lastName] = 'Probst'
    grp.attrs['hint'] = 'This group could be representing a person.'
    grp.rdf['hint'].definition = 'A hint gives helpful information on something.'
    grp.rdf.type = rdflib.PROV.Person  # --> rdf.type = Person
    grp.rdf.subject = 'https://orcid.org/0000-0001-8729-0482'  # -> @id='https://orcid.org/0000-0001-8729-0482'

    print(h5.dump_jsonld(indent=2, structural=True, resolve_keys=True))

graph = h5tbx.get_ld(h5.hdf_filename)
{
  "@context": {
    "dcterms": "http://purl.org/dc/terms/",
    "foaf": "http://xmlns.com/foaf/0.1/",
    "hdf": "http://purl.allotrope.org/ontologies/hdf5/1.8#",
    "prov": "http://www.w3.org/ns/prov#",
    "rdf": "http://www.w3.org/1999/02/22-rdf-syntax-ns#"
  },
  "@graph": [
    {
      "@id": "hdf:H5T_IEEE_F64LE",
      "@type": "hdf:Datatype"
    },
    {
      "@id": "_:7115aef7292c00e475e623dcc043964b",
      "@type": "hdf:File",
      "hdf:rootGroup": {
        "@id": "_:69ad64a678055ecde7601c70b432cdd3"
      }
    },
    {
      "@id": "_:69ad64a678055ecde7601c70b432cdd3",
      "@type": "hdf:Group",
      "hdf:member": [
        {
          "@id": "_:a571867387c9fd8a395adccb86a6ddda"
        },
        {
          "@id": "_:03e43b66f42e2e7f00f2288985db2abf"
        }
      ],
      "hdf:name": "/"
    },
    {
      "@id": "_:a571867387c9fd8a395adccb86a6ddda",
      "@type": "hdf:Dataset",
      "hdf:dataspace": {
        "@id": "hdf:scalarDataspace"
      },
      "hdf:datatype": [
        "H5T_FLOAT",
        {
          "@id": "hdf:H5T_IEEE_F64LE"
        }
      ],
      "hdf:layout": {
        "@id": "hdf:H5D_CONTIGUOUS"
      },
      "hdf:maximumSize": -1,
      "hdf:name": "/test",
      "hdf:rank": 0,
      "hdf:size": 1,
      "hdf:value": 4.3
    },
    {
      "@id": "_:03e43b66f42e2e7f00f2288985db2abf",
      "@type": "hdf:Group",
      "dcterms:relation": {
        "@id": "https://orcid.org/0000-0001-8729-0482"
      },
      "hdf:attribute": [
        {
          "@id": "_:N6300faff18614aa9bca73d5f90a8869a"
        },
        {
          "@id": "_:Nffe050dc3a084336a1eac2d1593d0eaf"
        },
        {
          "@id": "_:Nbb59cb74d5324f08b4b3900304e9c8ac"
        }
      ],
      "hdf:name": "/contact"
    },
    {
      "@id": "_:N6300faff18614aa9bca73d5f90a8869a",
      "@type": "hdf:StringAttribute",
      "hdf:data": "Probst",
      "hdf:name": "lname"
    },
    {
      "@id": "_:Nffe050dc3a084336a1eac2d1593d0eaf",
      "@type": "hdf:StringAttribute",
      "hdf:data": "This group could be representing a person.",
      "hdf:name": "hint"
    },
    {
      "@id": "_:Nbb59cb74d5324f08b4b3900304e9c8ac",
      "@type": "hdf:StringAttribute",
      "hdf:data": "Matthias",
      "hdf:name": "fname"
    },
    {
      "@id": "hdf:scalarDataspace",
      "@type": "hdf:scalarDataspace"
    },
    {
      "@id": "https://orcid.org/0000-0001-8729-0482",
      "@type": "prov:Person",
      "foaf:firstName": "Matthias",
      "foaf:lastName": "Probst"
    }
  ]
}
kg = kglab.KnowledgeGraph(
    import_graph=graph,
    namespaces={k: str(v) for k, v in dict(graph.namespaces()).items()})
subgraph = kglab.SubgraphTensor(kg)
VIS_STYLE= {
    "hdf": {"color": "red", "size": 30},
    "_": {"color": "black", "size": 20}
}
pyvis_graph = subgraph.build_pyvis_graph(notebook=True, style=VIS_STYLE)
# pyvis_graph.show('graph.html', notebook=True)
# the above call fails in the readthedocs build process... we show an image of the result here:
Warning: When cdn_resources is 'local' jupyter notebook has issues displaying graphics on chrome/safari. Use cdn_resources='in_line' or cdn_resources='remote' if you have issues viewing graphics in a notebook.
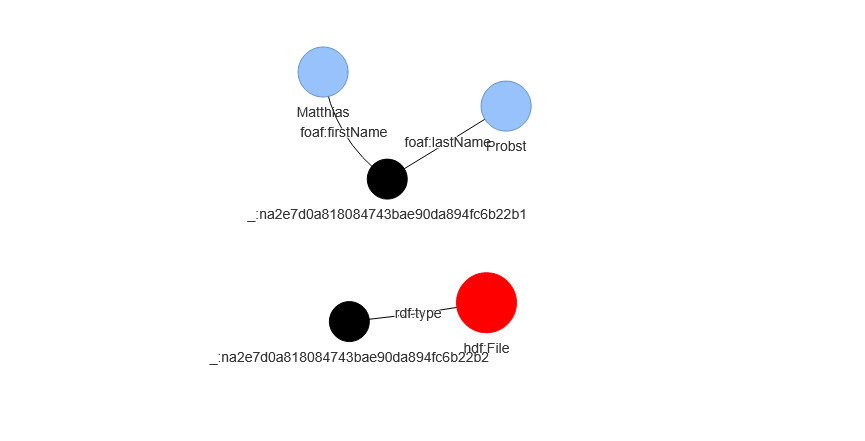
with h5tbx.File() as h5:
    h5.create_dataset(name='test', data=4.3)
    grp = h5.create_group(name='contact')
    grp.attrs['fname', rdflib.FOAF.firstName] = 'Matthias'
    grp.attrs['lname', rdflib.FOAF.lastName] = 'Probst'
    grp.attrs['hint'] = 'bah blah'
    grp.rdf['hint'].definition = 'A hint'
    grp.rdf.subject = rdflib.PROV.Person
    grp.attrs['@id'] = 'https://orcid.org/0000-0001-8729-0482'
    print(h5.dump_jsonld(indent=2, structural=False))

graph = h5tbx.get_ld(h5.hdf_filename, structural=False, use_simple_bnode_value=True)
{
  "@context": {
    "dcterms": "http://purl.org/dc/terms/",
    "foaf": "http://xmlns.com/foaf/0.1/",
    "prov": "http://www.w3.org/ns/prov#"
  },
  "@graph": [
    {
      "@id": "prov:Person",
      "foaf:firstName": "Matthias",
      "foaf:lastName": "Probst"
    },
    {
      "@id": "_:813e3d8728472b54b4dfe13fa3765aa8",
      "dcterms:relation": {
        "@id": "prov:Person"
      }
    }
  ]
}
VIS_STYLE= {
    "hdf": {"color": "red", "size": 30},
    "_": {"color": "black", "size": 20},
    "prof": {"color": "green", "size": 10},
    "foaf": {"color": "green", "size": 10}
}
kg_from_jsonld = kglab.KnowledgeGraph().load_rdf_text(
    graph.serialize(format="ttl")
)

subgraph = kglab.SubgraphTensor(kg_from_jsonld)
pyvis_graph = subgraph.build_pyvis_graph(notebook=True, style=VIS_STYLE)

pyvis_graph.force_atlas_2based(overlap=0)
# pyvis_graph.show("tmp.grpah.html", local=True, notebook=True)
# the above call fails in the readthedocs build process... we show an image of the result here:
Warning: When cdn_resources is 'local' jupyter notebook has issues displaying graphics on chrome/safari. Use cdn_resources='in_line' or cdn_resources='remote' if you have issues viewing graphics in a notebook.