Visualize HDF5 in a knowledge graph#
Using kglab (https://derwen.ai/docs/kgl/)
# !pip install kglab
import kglab
import rdflib
import numpy as np
/home/docs/checkouts/readthedocs.org/user_builds/h5rdmtoolbox/envs/v2.5.0/lib/python3.10/site-packages/kglab/util.py:35: FutureWarning: The pynvml package is deprecated. Please install nvidia-ml-py instead. If you did not install pynvml directly, please report this to the maintainers of the package that installed pynvml for you.
  import pynvml  # type: ignore  # pylint: disable=E0401
import h5rdmtoolbox as h5tbx
with h5tbx.File() as h5:
h5.create_dataset(name='test', data=4.3)
h5.create_dataset(name='nd-array', data=np.random.rand(2, 3), chunks=(1,3))
grp = h5.create_group(name='contact')
grp.attrs['fname', rdflib.FOAF.firstName] = 'Matthias'
grp.attrs['lname', rdflib.FOAF.lastName] = 'Probst'
grp.attrs['hint'] = 'This group could be representing a person.'
grp.rdf['hint'].definition = 'A hint gives helpful information on something.'
grp.rdf.type = rdflib.PROV.Person # --> rdf.type = Person
grp.rdf.subject = 'https://orcid.org/0000-0001-8729-0482' # -> @id='https://orcid.org/0000-0001-8729-0482'
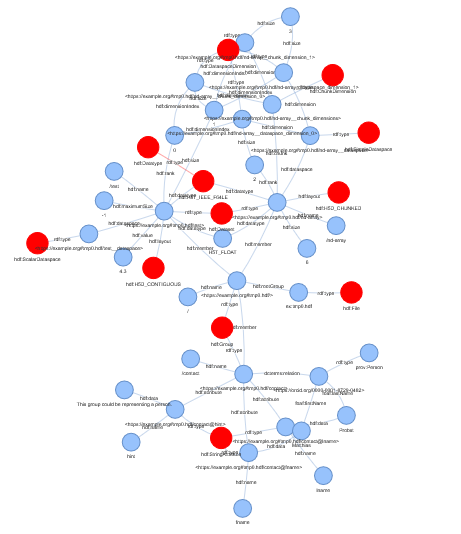
graph = h5tbx.get_ld(h5.hdf_filename, structural=True, file_uri="https://example.org#", context={"ex": "https://example.org#"})
print(graph.serialize())
@prefix ex: <https://example.org#> .
@prefix foaf: <http://xmlns.com/foaf/0.1/> .
@prefix hdf: <http://purl.allotrope.org/ontologies/hdf5/1.8#> .
@prefix prov: <http://www.w3.org/ns/prov#> .
@prefix schema: <https://schema.org/> .
@prefix xsd: <http://www.w3.org/2001/XMLSchema#> .

ex:tmp0.hdf a hdf:File ;
    hdf:rootGroup <https://example.org#tmp0.hdf/> .

<https://example.org#tmp0.hdf/> a hdf:Group ;
    hdf:member <https://example.org#tmp0.hdf/contact>,
        <https://example.org#tmp0.hdf/nd-array>,
        <https://example.org#tmp0.hdf/test> ;
    hdf:name "/" .

<https://example.org#tmp0.hdf/contact> a hdf:Group ;
    hdf:attribute <https://example.org#tmp0.hdf/contact@fname>,
        <https://example.org#tmp0.hdf/contact@hint>,
        <https://example.org#tmp0.hdf/contact@lname> ;
    hdf:name "/contact" ;
    schema:about <https://orcid.org/0000-0001-8729-0482> .

<https://example.org#tmp0.hdf/contact@fname> a hdf:StringAttribute ;
    hdf:data "Matthias" ;
    hdf:name "fname" .

<https://example.org#tmp0.hdf/contact@hint> a hdf:StringAttribute ;
    hdf:data "This group could be representing a person." ;
    hdf:name "hint" .

<https://example.org#tmp0.hdf/contact@lname> a hdf:StringAttribute ;
    hdf:data "Probst" ;
    hdf:name "lname" .

<https://example.org#tmp0.hdf/nd-array> a hdf:Dataset ;
    hdf:chunk <https://example.org#tmp0.hdf/nd-array__chunk_dimensions> ;
    hdf:dataspace <https://example.org#tmp0.hdf/nd-array__dataspace> ;
    hdf:datatype hdf:H5T_FLOAT,
        hdf:H5T_IEEE_F64LE ;
    hdf:layout hdf:H5D_CHUNKED ;
    hdf:maximumSize 6 ;
    hdf:name "/nd-array" ;
    hdf:rank 2 ;
    hdf:size 6 .

<https://example.org#tmp0.hdf/nd-array__chunk_dimension_0> a hdf:DataspaceDimension ;
    hdf:dimensionIndex 0 ;
    hdf:size 1 .

<https://example.org#tmp0.hdf/nd-array__chunk_dimension_1> a hdf:DataspaceDimension ;
    hdf:dimensionIndex 1 ;
    hdf:size 3 .

<https://example.org#tmp0.hdf/nd-array__chunk_dimensions> a hdf:ChunkDimension ;
    hdf:dimension <https://example.org#tmp0.hdf/nd-array__chunk_dimension_0>,
        <https://example.org#tmp0.hdf/nd-array__chunk_dimension_1> .

<https://example.org#tmp0.hdf/nd-array__dataspace> a hdf:SimpleDataspace ;
    hdf:dimension <https://example.org#tmp0.hdf/nd-array__dataspace_dimension_0>,
        <https://example.org#tmp0.hdf/nd-array__dataspace_dimension_1> .

<https://example.org#tmp0.hdf/nd-array__dataspace_dimension_0> a hdf:DataspaceDimension ;
    hdf:dimensionIndex 0 ;
    hdf:size 2 .

<https://example.org#tmp0.hdf/nd-array__dataspace_dimension_1> a hdf:DataspaceDimension ;
    hdf:dimensionIndex 1 ;
    hdf:size 3 .

<https://example.org#tmp0.hdf/test> a hdf:Dataset ;
    hdf:dataspace <https://example.org#tmp0.hdf/test__dataspace> ;
    hdf:datatype hdf:H5T_FLOAT,
        hdf:H5T_IEEE_F64LE ;
    hdf:layout hdf:H5D_CONTIGUOUS ;
    hdf:maximumSize -1 ;
    hdf:name "/test" ;
    hdf:rank 0 ;
    hdf:size 1 ;
    hdf:value 4.3e+00 .

<https://example.org#tmp0.hdf/test__dataspace> a hdf:ScalarDataspace .

<https://orcid.org/0000-0001-8729-0482> a prov:Person ;
    foaf:firstName "Matthias" ;
    foaf:lastName "Probst" .

hdf:H5T_IEEE_F64LE a hdf:Datatype .
namespaces = {k: str(v) for k, v in dict(graph.namespaces()).items()}
kg = kglab.KnowledgeGraph(
    import_graph=graph,
    namespaces=namespaces)
subgraph = kglab.SubgraphTensor(kg)
VIS_STYLE= {
    "hdf": {"color": "red", "size": 30},
    "_": {"color": "black", "size": 20}
}
pyvis_graph = subgraph.build_pyvis_graph(notebook=True, style=VIS_STYLE)
# pyvis_graph.show('graph.html', notebook=True)
# the above call fails in the readthedocs build process... we show an image of the result here:
Warning: When cdn_resources is 'local' jupyter notebook has issues displaying graphics on chrome/safari. Use cdn_resources='in_line' or cdn_resources='remote' if you have issues viewing graphics in a notebook.
with h5tbx.File() as h5:
h5.create_dataset(name='test', data=4.3)
grp = h5.create_group(name='contact')
grp.attrs['fname', rdflib.FOAF.firstName] = 'Matthias'
grp.attrs['lname', rdflib.FOAF.lastName] = 'Probst'
grp.attrs['hint'] = 'bah blah'
grp.rdf['hint'].definition = 'A hint'
grp.rdf.subject = rdflib.PROV.Person
grp.attrs['@id'] = 'https://orcid.org/0000-0001-8729-0482'
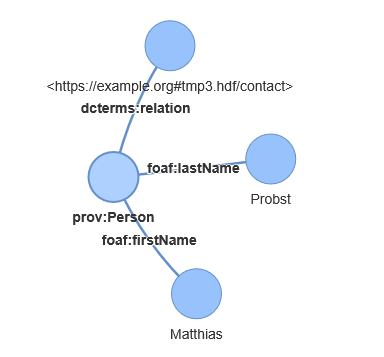
print(h5.dump_jsonld(indent=2, structural=False, file_uri="https://example.org#"))
graph = h5tbx.get_ld(h5.hdf_filename, structural=False, file_uri="https://example.org#")
{
  "@context": {
    "foaf": "http://xmlns.com/foaf/0.1/",
    "prov": "http://www.w3.org/ns/prov#",
    "schema": "https://schema.org/"
  },
  "@graph": [
    {
      "@id": "https://example.org#tmp1.hdf/contact",
      "schema:about": {
        "@id": "prov:Person"
      }
    },
    {
      "@id": "prov:Person",
      "foaf:firstName": "Matthias",
      "foaf:lastName": "Probst"
    }
  ]
}
VIS_STYLE= {
    "hdf": {"color": "red", "size": 30},
    "_": {"color": "black", "size": 20},
    "prof": {"color": "green", "size": 10},
    "foaf": {"color": "green", "size": 10}
}
kg_from_jsonld = kglab.KnowledgeGraph().load_rdf_text(
    graph.serialize(format="ttl")
)

subgraph = kglab.SubgraphTensor(kg_from_jsonld)
pyvis_graph = subgraph.build_pyvis_graph(notebook=True, style=VIS_STYLE)

pyvis_graph.force_atlas_2based(overlap=0)
# pyvis_graph.show("tmp.grpah.html", local=True, notebook=True)
# the above call fails in the readthedocs build process... we show an image of the result here:
Warning: When cdn_resources is 'local' jupyter notebook has issues displaying graphics on chrome/safari. Use cdn_resources='in_line' or cdn_resources='remote' if you have issues viewing graphics in a notebook.