Visualize HDF5 in a knowledge graph#
Using kglab (https://derwen.ai/docs/kgl/)
# !pip install kglab
import kglab
import rdflib
import numpy as np
---------------------------------------------------------------------------
ModuleNotFoundError                       Traceback (most recent call last)
Cell In[2], line 1
----> 1 import kglab
      2 import rdflib
      3 import numpy as np

ModuleNotFoundError: No module named 'kglab'
import h5rdmtoolbox as h5tbx
with h5tbx.File() as h5:
h5.create_dataset(name='test', data=4.3)
h5.create_dataset(name='nd-array', data=np.random.rand(2, 3), chunks=(1,3))
grp = h5.create_group(name='contact')
grp.attrs['fname', rdflib.FOAF.firstName] = 'Matthias'
grp.attrs['lname', rdflib.FOAF.lastName] = 'Probst'
grp.attrs['hint'] = 'This group could be representing a person.'
grp.rdf['hint'].definition = 'A hint gives helpful information on something.'
grp.rdf.type = rdflib.PROV.Person # --> rdf.type = Person
grp.rdf.subject = 'https://orcid.org/0000-0001-8729-0482' # -> @id='https://orcid.org/0000-0001-8729-0482'
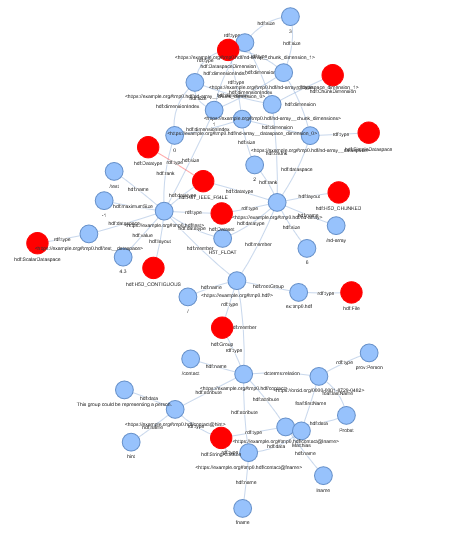
graph = h5tbx.get_ld(h5.hdf_filename, structural=True, file_uri="https://example.org#", context={"ex": "https://example.org#"})
print(graph.serialize())
namespaces = {k: str(v) for k, v in dict(graph.namespaces()).items()}
kg = kglab.KnowledgeGraph(
    import_graph=graph,
    namespaces=namespaces)
subgraph = kglab.SubgraphTensor(kg)
VIS_STYLE= {
    "hdf": {"color": "red", "size": 30},
    "_": {"color": "black", "size": 20}
}
pyvis_graph = subgraph.build_pyvis_graph(notebook=True, style=VIS_STYLE)
# pyvis_graph.show('graph.html', notebook=True)
# the above call fails in the readthedocs build process... we show an image of the result here:
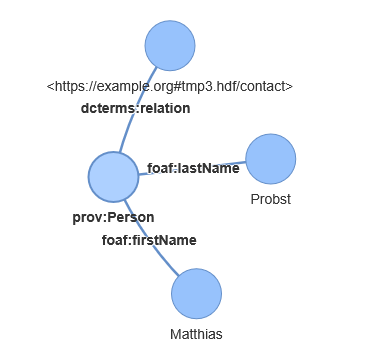
with h5tbx.File() as h5:
    h5.create_dataset(name='test', data=4.3)
    grp = h5.create_group(name='contact')
    grp.attrs['fname', rdflib.FOAF.firstName] = 'Matthias'
    grp.attrs['lname', rdflib.FOAF.lastName] = 'Probst'
    grp.attrs['hint'] = 'bah blah'
    grp.rdf['hint'].definition = 'A hint'
    grp.rdf.subject = rdflib.PROV.Person
    grp.attrs['@id'] = 'https://orcid.org/0000-0001-8729-0482'
    print(h5.dump_jsonld(indent=2, structural=False, file_uri="https://example.org#"))

graph = h5tbx.get_ld(h5.hdf_filename, structural=False, file_uri="https://example.org#")
VIS_STYLE= {
    "hdf": {"color": "red", "size": 30},
    "_": {"color": "black", "size": 20},
    "prof": {"color": "green", "size": 10},
    "foaf": {"color": "green", "size": 10}
}
kg_from_jsonld = kglab.KnowledgeGraph().load_rdf_text(
    graph.serialize(format="ttl")
)

subgraph = kglab.SubgraphTensor(kg_from_jsonld)
pyvis_graph = subgraph.build_pyvis_graph(notebook=True, style=VIS_STYLE)

pyvis_graph.force_atlas_2based(overlap=0)
# pyvis_graph.show("tmp.grpah.html", local=True, notebook=True)
# the above call fails in the readthedocs build process... we show an image of the result here: