Visualize HDF5 in a knowledge graph#
Using kglab (https://derwen.ai/docs/kgl/)
# !pip install kglab
import kglab
import rdflib
import h5rdmtoolbox as h5tbx
---------------------------------------------------------------------------
ModuleNotFoundError                       Traceback (most recent call last)
Cell In[3], line 1
----> 1 import h5rdmtoolbox as h5tbx

File ~/checkouts/readthedocs.org/user_builds/h5rdmtoolbox/checkouts/v1.7.0/h5rdmtoolbox/__init__.py:129
    125     with File(src) as h5:
    126         return h5.dumps()
--> 129 from h5rdmtoolbox.wrapper.ld.hdf.file import get_ld as hdf_get_ld
    130 from h5rdmtoolbox.wrapper.ld.user.file import get_ld as user_get_ld
    133 def get_ld(
    134         hdf_filename: Union[str, pathlib.Path],
    135         structural: bool = True,
    136         semantic: bool = True,
    137         blank_node_iri_base: Optional[str] = None,
    138         **kwargs) -> rdflib.Graph:

File ~/checkouts/readthedocs.org/user_builds/h5rdmtoolbox/checkouts/v1.7.0/h5rdmtoolbox/wrapper/ld/__init__.py:1
----> 1 import ssnolib.ssno.standard_name
      2 from ontolutils.namespacelib import M4I
      3 from ontolutils.namespacelib import SCHEMA

ModuleNotFoundError: No module named 'ssnolib'
with h5tbx.File() as h5:
    h5.create_dataset(name='test', data=4.3)
    grp = h5.create_group(name='contact')
    grp.attrs['fname', rdflib.FOAF.firstName] = 'Matthias'
    grp.attrs['lname', rdflib.FOAF.lastName] = 'Probst'
    grp.attrs['hint'] = 'This group could be representing a person.'
    grp.rdf['hint'].definition = 'A hint gives helpful information on something.'
    grp.rdf.type = rdflib.PROV.Person  # --> rdf.type = Person
    grp.rdf.subject = 'https://orcid.org/0000-0001-8729-0482'  # -> @id='https://orcid.org/0000-0001-8729-0482'

    print(h5.dump_jsonld(indent=2, structural=True, resolve_keys=True))

graph = h5tbx.get_ld(h5.hdf_filename)
{
  "@context": {
    "foaf": "http://xmlns.com/foaf/0.1/",
    "hdf": "http://purl.allotrope.org/ontologies/hdf5/1.8#",
    "prov": "http://www.w3.org/ns/prov#",
    "rdf": "http://www.w3.org/1999/02/22-rdf-syntax-ns#"
  },
  "@graph": [
    {
      "@id": "_:69ad64a678055ecde7601c70b432cdd3",
      "@type": "hdf:File"
    },
    {
      "@id": "hdf:scalarDataspace",
      "@type": "hdf:scalarDataspace"
    },
    {
      "@id": "hdf:H5T_IEEE_F64LE",
      "@type": "hdf:Datatype"
    },
    {
      "@id": "_:03e43b66f42e2e7f00f2288985db2abf",
      "@type": "prov:Person",
      "foaf:firstName": "Matthias",
      "foaf:lastName": "Probst"
    },
    {
      "@id": "https://orcid.org/0000-0001-8729-0482",
      "@type": "prov:Person"
    }
  ]
}
kg = kglab.KnowledgeGraph(
    import_graph=graph,
    namespaces={k: str(v) for k, v in dict(graph.namespaces()).items()})
subgraph = kglab.SubgraphTensor(kg)
VIS_STYLE= {
    "hdf": {"color": "red", "size": 30},
    "_": {"color": "black", "size": 20}
}
pyvis_graph = subgraph.build_pyvis_graph(notebook=True, style=VIS_STYLE)
# pyvis_graph.show('graph.html', notebook=True)
# the above call fails in the readthedocs build process... we show an image of the result here:
Warning: When cdn_resources is 'local' jupyter notebook has issues displaying graphics on chrome/safari. Use cdn_resources='in_line' or cdn_resources='remote' if you have issues viewing graphics in a notebook.

with h5tbx.File() as h5:
    h5.create_dataset(name='test', data=4.3)
    grp = h5.create_group(name='contact')
    grp.attrs['fname', rdflib.FOAF.firstName] = 'Matthias'
    grp.attrs['lname', rdflib.FOAF.lastName] = 'Probst'
    grp.attrs['hint'] = 'bah blah'
    grp.rdf['hint'].definition = 'A hint'
    grp.rdf.subject = rdflib.PROV.Person
    grp.attrs['@id'] = 'https://orcid.org/0000-0001-8729-0482'
    print(h5.dump_jsonld(indent=2, structural=False))

graph = h5tbx.get_ld(h5.hdf_filename, structural=False, use_simple_bnode_value=True)
{
  "@context": {
    "foaf": "http://xmlns.com/foaf/0.1/",
    "hdf": "http://purl.allotrope.org/ontologies/hdf5/1.8#",
    "rdf": "http://www.w3.org/1999/02/22-rdf-syntax-ns#"
  },
  "@graph": [
    {
      "@id": "_:af3b30750dbfd021eb8843274633ba46",
      "@type": "hdf:File"
    },
    {
      "@id": "_:33501378e9a891ca7b7655ee472f25b4",
      "foaf:firstName": "Matthias",
      "foaf:lastName": "Probst"
    }
  ]
}
VIS_STYLE= {
    "hdf": {"color": "red", "size": 30},
    "_": {"color": "black", "size": 20},
    "prof": {"color": "green", "size": 10},
    "foaf": {"color": "green", "size": 10}
}
kg_from_jsonld = kglab.KnowledgeGraph().load_rdf_text(
graph.serialize(format="ttl")
)
subgraph = kglab.SubgraphTensor(kg_from_jsonld)
pyvis_graph = subgraph.build_pyvis_graph(notebook=True, style=VIS_STYLE)
pyvis_graph.force_atlas_2based(overlap=0)
# pyvis_graph.show("tmp.grpah.html", local=True, notebook=True)
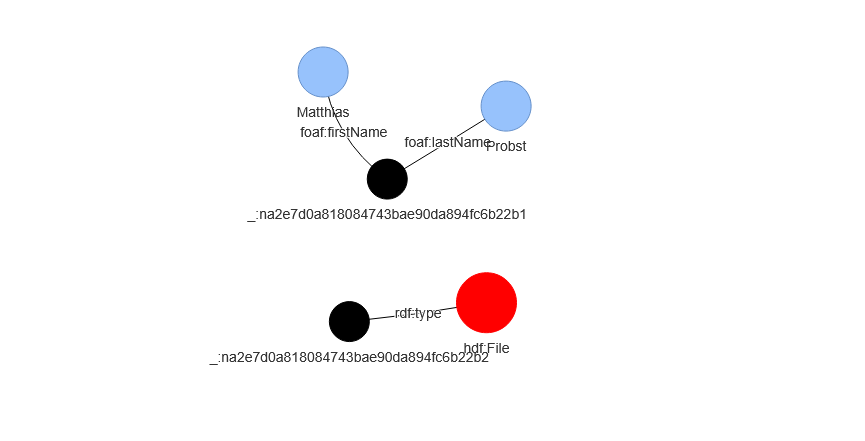
# the above call fails in the readthedocs build process... we show an image of the result here:
Warning: When cdn_resources is 'local' jupyter notebook has issues displaying graphics on chrome/safari. Use cdn_resources='in_line' or cdn_resources='remote' if you have issues viewing graphics in a notebook.