Working with time data#
Give your file, group or dataset a timestamp by calling .write_iso_timestamp()
import h5rdmtoolbox as h5tbx

with h5tbx.File() as h5:
    h5.attrs.write_iso_timestamp()
    h5.dump()
---------------------------------------------------------------------------
ModuleNotFoundError                       Traceback (most recent call last)
Cell In[1], line 1
----> 1 import h5rdmtoolbox as h5tbx
      3 with h5tbx.File() as h5:
      4     h5.attrs.write_iso_timestamp()

File ~/checkouts/readthedocs.org/user_builds/h5rdmtoolbox/checkouts/v1.7.0/h5rdmtoolbox/__init__.py:129
    125     with File(src) as h5:
    126         return h5.dumps()
--> 129 from h5rdmtoolbox.wrapper.ld.hdf.file import get_ld as hdf_get_ld
    130 from h5rdmtoolbox.wrapper.ld.user.file import get_ld as user_get_ld
    133 def get_ld(
    134         hdf_filename: Union[str, pathlib.Path],
    135         structural: bool = True,
    136         semantic: bool = True,
    137         blank_node_iri_base: Optional[str] = None,
    138         **kwargs) -> rdflib.Graph:

File ~/checkouts/readthedocs.org/user_builds/h5rdmtoolbox/checkouts/v1.7.0/h5rdmtoolbox/wrapper/ld/__init__.py:1
----> 1 import ssnolib.ssno.standard_name
      2 from ontolutils.namespacelib import M4I
      3 from ontolutils.namespacelib import SCHEMA

ModuleNotFoundError: No module named 'ssnolib'
HDF5 cannot store datetime objects. The solution is to store them as string-datasets. Therefore, datetime is written to the HDF5 datasets in ISO-format. When data is requested, it is converted back to numpy.datetime64 format and fed into the xarray object. Note, that you may use the method create_time_dataset instead of constructing the string dataset yourself. In fact, this is recommended, because some attributes must be set in order to identify a dataset as a “time-data-dataset”:
import datetime
with h5tbx.File() as h5:
h5.create_time_dataset('time',
data=[datetime.datetime.now(),
datetime.datetime.now()+datetime.timedelta(hours=1),
datetime.datetime.now()+datetime.timedelta(hours=3)],
time_format='iso', make_scale=True)
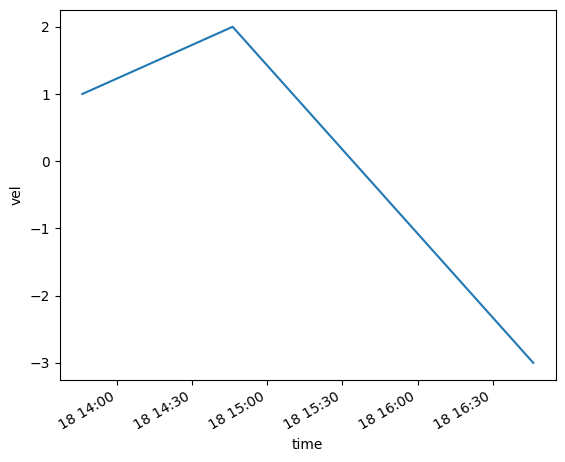
h5.create_dataset('vel', data=[1,2,-3], attach_scale='time')
v = h5.vel[()]
t = h5.time[()]
h5.dump()
-
-
: [|S26]
- time_format
 https://matthiasprobst.github.io/pivmeta#timeFormat: %Y-%m-%dT%H:%M:%S.%f
-
(time: 3) [int32]
- time_format
v.plot()
[<matplotlib.lines.Line2D at 0x262b61f5f70>]