Provenance#
One aspect of data provenance is keeping track of the processing steps applied to data.
Next, we will learn how this can be done working with xarray objects.
Note: This is work in progress! Adding provenance information can clutter the attributes of a xarray quite a bit
import h5rdmtoolbox as h5tbx
import numpy as np

h5tbx.set_config(add_provenance=True)
---------------------------------------------------------------------------
ModuleNotFoundError                       Traceback (most recent call last)
Cell In[1], line 1
----> 1 import h5rdmtoolbox as h5tbx
      2 import numpy as np
      4 h5tbx.set_config(add_provenance=True)

File ~/checkouts/readthedocs.org/user_builds/h5rdmtoolbox/checkouts/v1.7.0/h5rdmtoolbox/__init__.py:129
    125     with File(src) as h5:
    126         return h5.dumps()
--> 129 from h5rdmtoolbox.wrapper.ld.hdf.file import get_ld as hdf_get_ld
    130 from h5rdmtoolbox.wrapper.ld.user.file import get_ld as user_get_ld
    133 def get_ld(
    134         hdf_filename: Union[str, pathlib.Path],
    135         structural: bool = True,
    136         semantic: bool = True,
    137         blank_node_iri_base: Optional[str] = None,
    138         **kwargs) -> rdflib.Graph:

File ~/checkouts/readthedocs.org/user_builds/h5rdmtoolbox/checkouts/v1.7.0/h5rdmtoolbox/wrapper/ld/__init__.py:1
----> 1 import ssnolib.ssno.standard_name
      2 from ontolutils.namespacelib import M4I
      3 from ontolutils.namespacelib import SCHEMA

ModuleNotFoundError: No module named 'ssnolib'
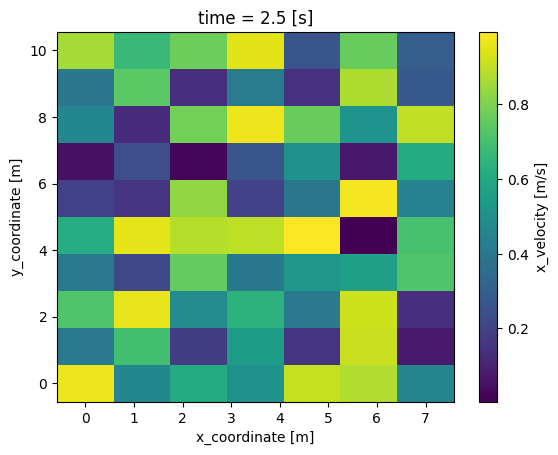
For the example, let’s assume a 3D-velocity field with time, y- and x-dimension:
cv = h5tbx.convention.from_zenodo('https://zenodo.org/records/10428822')

h5tbx.use(cv)
using("h5rdmtoolbox-tutorial-convention")
with h5tbx.File(data_type='experimental', contact=h5tbx.__author_orcid__) as h5:
    h5.create_dataset('time', data=np.linspace(0, 5, 5), standard_name='time', units='s', make_scale=True)
    h5.create_dataset('y', data=np.linspace(0, 10, 10), standard_name='y_coordinate', units='m', make_scale=True)
    h5.create_dataset('x', data=np.linspace(0, 7, 7), standard_name='x_coordinate', units='m', make_scale=True)
    h5.create_dataset('u', data=np.random.rand(5, 10, 7), standard_name='x_velocity', units='m/s', attach_scale=('time', 'y', 'x'))
    u = h5.u[:]

# plot t=2.5 s:
u.sel(time=2.5).plot()
<matplotlib.collections.QuadMesh at 0x14da81851f0>
from h5rdmtoolbox.convention.standard_names import accessor
u_processed = u.snt[0:2,...].snt.arithmetic_mean_of(dim='time')

def get_dim_shape(da):
    return {d: len(da[d]) for d in da.dims}

def explain_history(da):
    for i, item in enumerate(da.attrs['PROVENANCE']['processing_history']):
        print(i, 'applied ', item['name'], ' on array with shape', item['parent']['dims_shape'])
        print('  -> ', item['name'])
    print('Current shape ', get_dim_shape(da))

explain_history(u_processed)
0 applied  __getitem__  on array with shape {'time': 5, 'y': 10, 'x': 7}
  ->  __getitem__
1 applied  arithmetic_mean_of  on array with shape {'time': 2, 'y': 10, 'x': 7}
  ->  arithmetic_mean_of
Current shape  {'y': 10, 'x': 7}
h5tbx.set_config(add_provenance=False)
<h5rdmtoolbox._cfg.set_config at 0x14daa40fe50>